People are naturally interested in slicing the ICML acceptance statistics in various ways. Here’s a rundown for the top categories.
| 18/66 = 0.27 |
in (0.18,0.36) |
Reinforcement Learning |
| 10/52 = 0.19 |
in (0.17,0.37) |
Supervised Learning |
| 9/51 = 0.18 |
not in (0.18, 0.37) |
Clustering |
| 12/46 = 0.26 |
in (0.17, 0.37) |
Kernel Methods |
| 11/40 = 0.28 |
in (0.15, 0.4) |
Optimization Algorithms |
| 8/33 = 0.24 |
in (0.15, 0.39) |
Learning Theory |
| 14/33 = 0.42 |
not in (0.15, 0.39) |
Graphical Models |
| 10/32 = 0.31 |
in (0.15, 0.41) |
Applications (+5 invited) |
| 8/29 = 0.28 |
in (0.14, 0.41]) |
Probabilistic Models |
| 13/29 = 0.45 |
not in (0.14, 0.41) |
NN & Deep Learning |
| 8/26 = 0.31 |
in (0.12, 0.42) |
Transfer and Multi-Task Learning |
| 13/25 = 0.52 |
not in (0.12, 0.44) |
Online Learning |
| 5/25 = 0.20 |
in (0.12, 0.44) |
Active Learning |
| 6/22 = 0.27 |
in (0.14, 0.41) |
Semi-Supervised Learning |
| 7/20 = 0.35 |
in (0.1, 0.45) |
Statistical Methods |
| 4/20 = 0.20 |
in (0.1, 0.45) |
Sparsity and Compressed Sensing |
| 1/19 = 0.05 |
not in (0.11, 0.42) |
Ensemble Methods |
| 5/18 = 0.28 |
in (0.11, 0.44) |
Structured Output Prediction |
| 4/18 = 0.22 |
in (0.11, 0.44) |
Recommendation and Matrix Factorization |
| 7/18 = 0.39 |
in (0.11, 0.44) |
Latent-Variable Models and Topic Models |
| 1/17 = 0.06 |
not in (0.12, 0.47) |
Graph-Based Learning Methods |
| 5/16 = 0.31 |
in (0.13, 0.44) |
Nonparametric Bayesian Inference |
| 3/15 = 0.20 |
in (0.7, 0.47) |
Unsupervised Learning and Outlier Detection |
| 7/12 = 0.58 |
not in (0.08, 0.50) |
Gaussian Processes |
| 5/11 = 0.45 |
not in (0.09, 0.45) |
Ranking and Preference Learning |
| 2/11 = 0.18 |
in (0.09, 0.45) |
Large-Scale Learning |
| 0/9 = 0.00 |
in [0, 0.56) |
Vision |
| 3/9 = 0.33 |
in [0, 0.56) |
Social Network Analysis |
| 0/9 = 0.00 |
in [0, 0.56) |
Multi-agent & Cooperative Learning |
| 2/9 = 0.22 |
in [0, 0.56) |
Manifold Learning |
| 4/8 = 0.50 |
not in [0, 0.5) |
Time-Series Analysis |
| 2/8 = 0.25 |
in [0, 0.5] |
Large-Margin Methods |
| 2/8 = 0.25 |
in [0, 0.5] |
Cost Sensitive Learning |
| 2/7 = 0.29 |
in [0, 0.57) |
Recommender Systems |
| 3/7 = 0.43 |
in [0, 0.57) |
Privacy, Anonymity, and Security |
| 0/7 = 0.00 |
in [0, 0.57) |
Neural Networks |
| 0/7 = 0.00 |
in [0, 0.57) |
Empirical Insights |
| 0/7 = 0.00 |
in [0, 0.57) |
Bioinformatics |
| 1/6 = 0.17 |
in [0, 0.5) |
Information Retrieval |
| 2/6 = 0.33 |
in [0, 0.5) |
Evaluation Methodology |
Update: See Brendan’s graph for a visualization.
I usually find these numbers hard to interpret. At the grossest level, all areas have significant selection. At a finer level, one way to add further interpretation is to pretend that the acceptance rate of all papers is 0.27, then compute a 5% lower tail and a 5% upper tail. With 40 categories, we expect to have about 4 violations of tail inequalities. Instead, we have 9, so there is some evidence that individual areas are particularly hot or cold. In particular, the hot topics are Graphical models, Neural Networks and Deep Learning, Online Learning, Gaussian Processes, Ranking and Preference Learning, and Time Series Analysis. The cold topics are Clustering, Ensemble Methods, and Graph-Based Learning Methods.
We also experimented with AIStats resubmits (3/4 accepted) and NFP papers (4/7 accepted) but the numbers were to small to read anything significant.
One thing that surprised me was how uniform decisions were as a function of average score in reviews. All reviews included a decision from {Strong Reject, Weak Reject, Weak Accept, Strong Accept}. These were mapped to numbers in the range {1,2,3,4}. In essence, average review score < 2.2 meant 0% chance of acceptance, and average review score > 3.1 meant acceptance. Due to discretization in the number of reviewers and review scores there were only 3 typical uncertain outcomes:
- 2.33. This was either 2 Weak Rejects+Weak Accept or Strong Reject+2 Weak Accepts or (rarely) Strong Reject+Weak Reject+Strong Accept. About 8% of these paper were accepted.
- 2.67. This was either Weak Reject+Weak Accept*2 or Strong Accept+2 Weak Rejects or (rarely) Strong Reject+Weak Accept+Strong Accept. About 48% of these paper were accepted.
- 3.0. This was commonly 3 Weak Accepts or Strong Accept+Weak Accept+Weak Reject or (rarely) 2 Strong Accepts + Strong Reject. About 90% of these papers were accepted.
One question I’ve always wondered is: How much variance is there in the accept/reject decision? In general, correlated assignment of reviewers can greatly increase the amount of variance, so one of our goals this year was doing as independent an assignment as possible. If you accept that as independence, we essentially get 3 samples for each paper where the average standard deviation of reviewer scores before author feedback and discussion is 0.64. After author feedback and discussion the standard deviation drops to 0.51. If we pretend that papers have an intrinsic value between 1 and 4 then think of reviews as discretized gaussian measurements fed through the above decision criteria, we get the following:
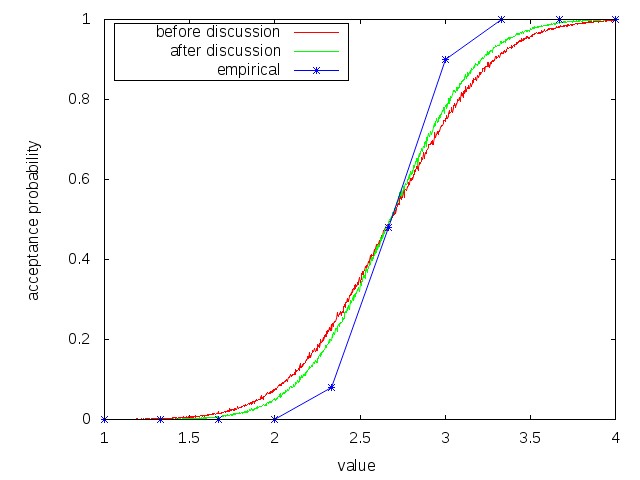
There are great caveats to this picture. For example, treating the AC’s decision as random conditioned on the reviewer average is a worst-case analysis. The reality is that ACs are removing noise from the few events that I monitored carefully, although it is difficult to quantify this. Similarly, treating the reviews observed after discussion as independent is clearly flawed. A reasonable way to look at it is: author feedback and discussion get us about 1/3 or 1/4 of the way to the final decision from the initial reviews.
Conditioned on the papers, discussion, author feedback and reviews, AC’s are pretty uniform in their decisions with ~30 papers where ACs disagreed on the accept/reject decision. For half of those, the ACs discussed further and agreed, leaving Joelle and I a feasible quantity of cases to look at (plus several other exceptions).
At the outset, we promised a zero-spof reviewing process. We actually aimed higher: at least 3 people needed to make a wrong decision for the ICML 2012 reviewing process to kick out a wrong decision. I expect this happened a few times given the overall level of quality disagreement and quantities involved, but hopefully we managed to reduce the noise appreciably.