HOMER: Provable Exploration in Reinforcement Learning

Last week at ICML 2020, Mikael HenaffAkshay KrishnamurthyJohn Langford and I had a paper on a new reinforcement learning (RL) algorithm that solves three key problems in RL: (i) global exploration, (ii) decoding latent dynamics, and (iii) optimizing a given reward function. Our ICML poster is here.

The paper is a bit mathematically heavy in nature so this post is an attempt to distill the key findings. We will also be following up soon with a new codebase release (more on it later).

Rich-observation RL landscape

Consider the combination lock problem shown below. The agent starts in the state s1a or s1b with equal probability. After taking h-1 actions, the agent will be in either state sha, shb, or shc. The agent can take 10 different actions. The agent observes a high-dimensional observation (focus circle) instead of the underlying state which is latent. There is a big treasure chest that one can get after taking 100 actions. We view the states with subscript “a” or “b” as “good states” and one with subscript “c” as “bad states”. You can reach the treasure chest at the end only if you remain in good states. If you reach any bad state, then you can never make it to the treasure chest.
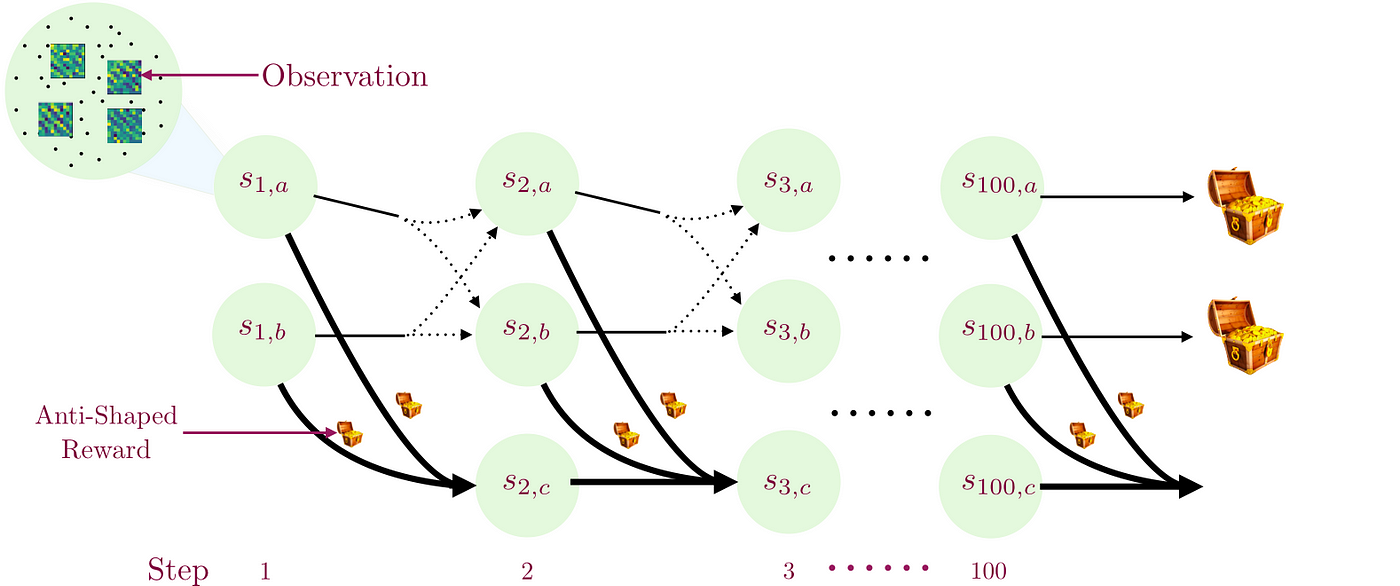
The environment makes it difficult to reach the big treasure chest in three ways. First, the environmental dynamics are such that if you are in good states, then only 1 out of 10 possible actions will let you reach the two good states at the next time step with equal probability (the good action changes from state to state). Every other action in good states and all actions in bad states put you into bad states at the next time step, from which it is impossible to recover. Second, it misleads myopic agents by giving a small bonus for transitioning from a good state to a bad state (small treasure chest). This means that a locally optimal policy is transitions to one of the bad states as quickly as possible. Third, the agent never directly observes which state it is in. Instead, it receives a high-dimensional, noisy observation from which it must decode the true underlying state.

It is easy to see that if we take actions uniformly at random, then the probability of reaching the big treasure chest at the end is 1/10100. The number 10100 is called Googol and is larger than the current estimate of number of elementary particles in the universe. Furthermore, since transitions are stochastic one can show that no fixed sequence of actions performs well either.

A key aspect of the rich-observation setting is that the agent receives observations instead of latent state. The observations are stochastically sampled from an infinitely large space conditioned on the state. However, observations are rich-enough to enable decoding the latent state which generates them.

What does provable RL mean?

A provable RL algorithm means that for any given numbers ed in (0, 1); we can learn an e-optimal policy with probability at least 1-d using a number of episodes which are polynomial in relevant quantities (state size, horizon, action space, 1/e, 1/d, etc.). By e-optimal policy we mean a policy whose value (expected total return) is at most e less than the optimal return.

Thus, a provable RL algorithm is capable of learning a close to optimal policy with high probability (where the word high and close can be made arbitrarily more refined), provided the assumptions it makes are satisfied.

Why should I care if my algorithm is provable?

There are two main advantages of being able to show your algorithm is provable:

  1. We can only test an algorithm on a finite number of environments (in practice somewhere between 1 and 20). Without guarantees, we don’t know how they will behave in a new environment. This matters especially if failure in a new environment can result in high real-world costs (e.g., in health or financial domains).
  2. If a provable algorithm fails to consistently give the desired result, this can be attributed to failure of at least one of its assumptions. A developer can then look at the assumptions and try to determine which ones are violated, and either intervene to fix them or determine that the algorithm is not appropriate for the problem.

HOMER

Our algorithm addresses what is known as the Block MDP setting. In this setting, a small number of discrete states generates a potentially infinite number of high dimensional observations.

For each time step, HOMER learns a state decoder function, and a set of exploration policies. The state decoder maps high-dimensional observations to a small set of possible latent states, while the exploration policies map observations to actions which will lead the agent to each of the latent states. We describe HOMER below.

  • For a given time step, we first learn a decoder for mapping observations to a small set of values using contrastive learning. This procedure works as follows: collect a transition by following a randomly sampled exploration policy from the previous time step until that time step, and then taking a single random action. We use this procedure to sample two transitions shown below.
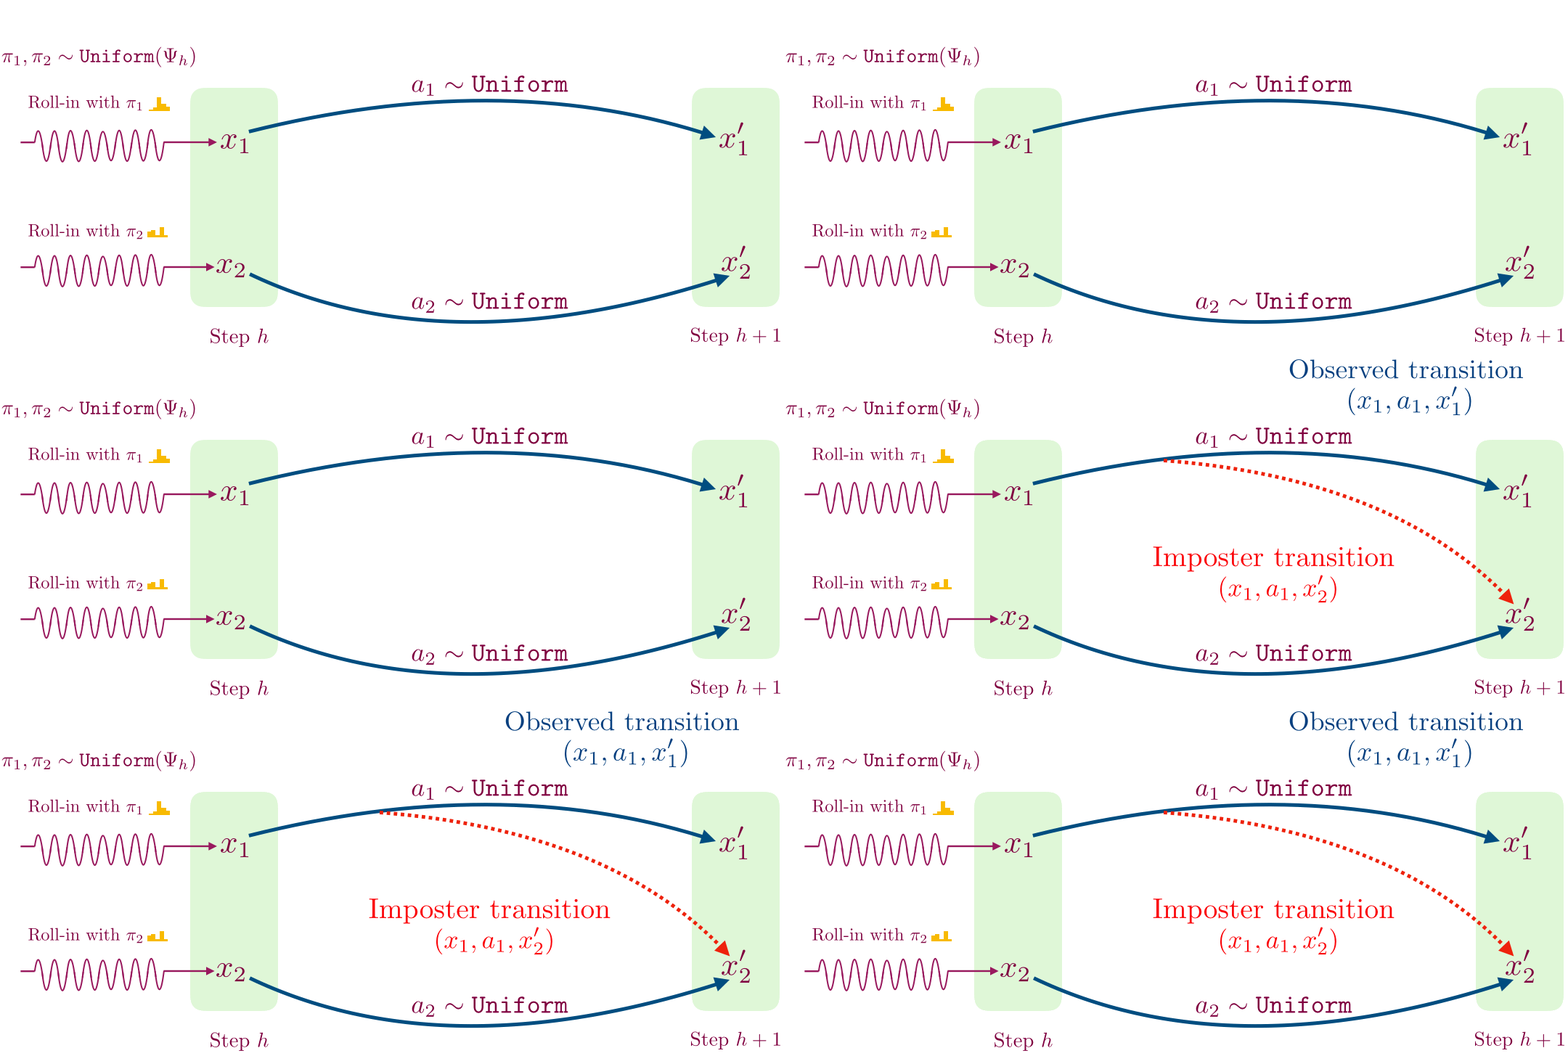
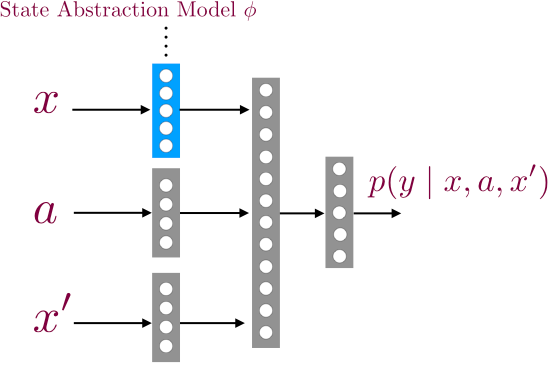
  • We then flip a coin; if we get heads then we store the transition (x1, a1, x’1), and otherwise we store the imposter transition (x1, a1, x’2). We train a supervised classifier to predict if a given transition (x, a, x’) is real or not.
    This classifier has a special structure which allows us to recover a decoder for time step h.
  • Once we have learned the state decoder, we will learn an exploration policy for every possible value of the decoder (which we call abstract state as they are related to the latent state space). This step is standard can be done using many different approaches such as model-based planning, model-free methods, etc. In the paper we use an existing model-free algorithm called policy search by dynamic programming (PSDP) by Bagnell et al. 2004.
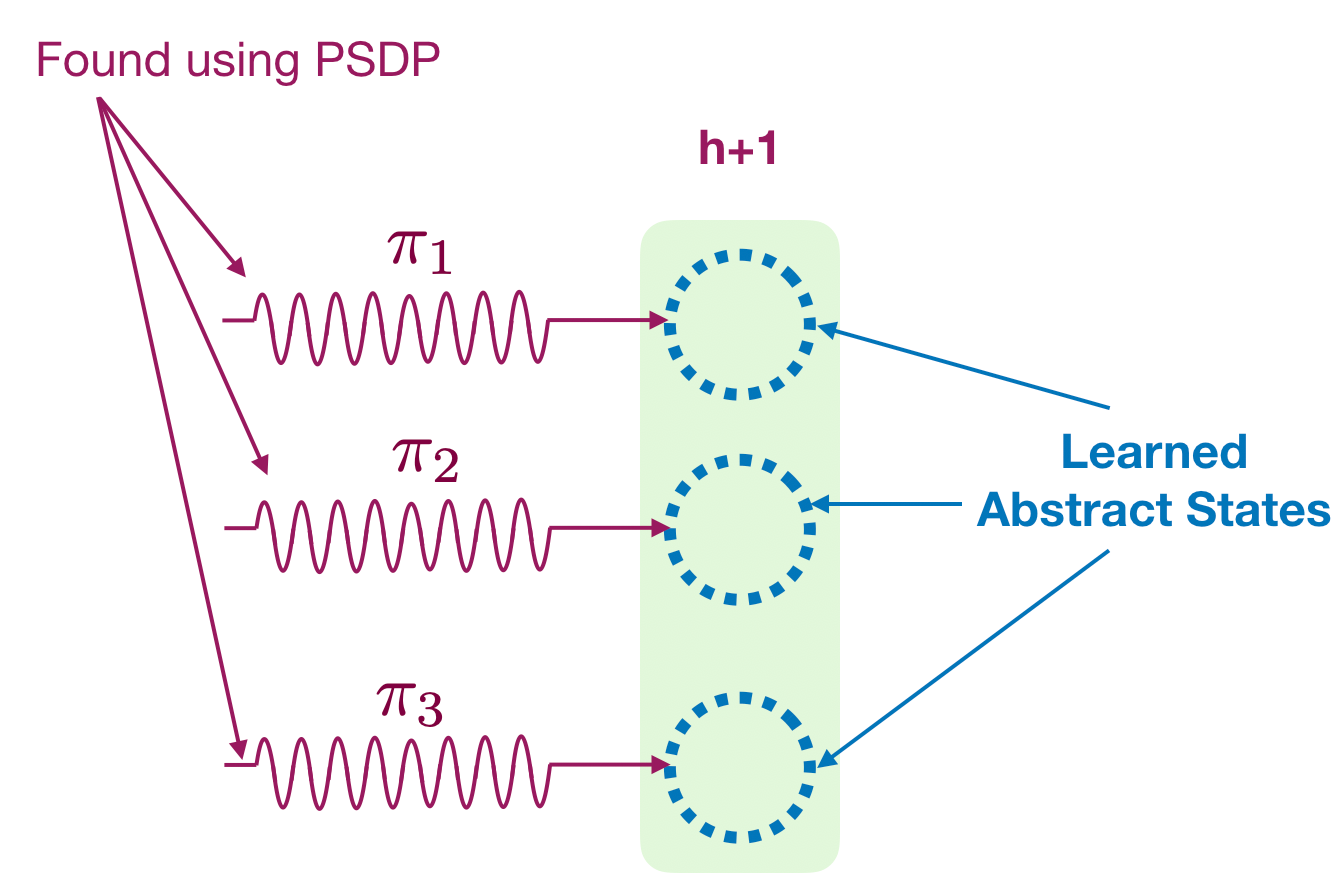
  • We recovered a decoder and a set of exploration policy for this time step. We then keep doing it for every time step and learn a decoder and exploration policy for the whole latent state space. Finally, we can easily optimize any given reward function using any provable planner like PSDP or a model-based algorithm. (The algorithm actually recovers the latent state space up to an inherent ambiguity by combining two different decoders; but I’ll leave that to avoid overloading this post).

Key findings

HOMER achieves the following three properties:

  1. The contrastive learning procedure gives us the right state decoding (we recover up to some inherent ambiguity but I won’t cover it here).
  2. HOMER can learn a set of exploration policies to reach every latent state
  3. HOMER can learn a nearly-optimal policy for any given reward function with high probability. Further, this can be done after exploration part has been performed.

Failure cases of prior RL algorithms

There are many RL algorithms in the literature and many new are proposed every month. It is difficult to do justice to this vast literature in a blog post. It is equally difficult to situate HOMER in this vast literature. However, we show that several very commonly used RL algorithms fail to solve the above problem while HOMER succeeds. One of these is the PPO algorithm, a widely used policy gradient algorithm. In spite of its popular use, PPO is not designed for challenging exploration problems and easily fails. Researchers have made efforts to alleviate this with ad-hoc proposals such as using prediction errors, counts based on auto-encoders, etc. The best alternative approach we found is called Random Network Distillation(RND) which measures novelty of a state based on prediction errors for a fixed randomly initialized network.

Below we show how PPO+RND fails to solve the above problem while HOMER succeeds. We simplify the problem by using a grid pattern where rows represent the state (the top two represents “good” states and bottom row represents “bad” states), and column represents timestep.

We present counter-examples for other algorithms in the paper (see Section 6 here). These counterexamples allow us to find limits of prior work without expensive empirical computation on many domains.

How can I use with HOMER?

We will be providing the code soon as part of a new package release called cereb-rl. You can find it here: https://github.com/cereb-rl and join the discussion here: https://gitter.im/cereb-rl
Critical issues in digital contract tracing

I spent the last month becoming a connoisseur of digital contact tracing approaches since this seems like something where I might be able to help. Many other people have been thinking along similar lines (great), but I also see several misconceptions that even smart and deeply involved people are making.

For the following a key distinction to understand is between proximity and location approaches. In proximity approaches (such as DP3T, TCN, MIT PACT(*), Apple or one of the UW PACT(*) protocols which I am involved in) smartphones use Bluetooth low energy and possibly ultrasonics to discover other smartphones nearby. Location approaches (such as MIT Safe Paths or Israel) instead record the absolute location of the device based on gps, cell tower triangulation, or wifi signals.

Location traces are both poor quality and intrinsically identifying
Many people associate the ability of a phone to determine where it is with the ability to discover where it is with high precision. This is typically incorrect. Common healthcare guidance for possible contact is “within 2 meters for 10 minutes” while location data is often off by 10-100 meters, with varying accuracy due to which location methodology is in use. As an example, approximately everyone in Manhattan may be within 100 meters of someone who later tested positive for COVID-19. Given this inaccuracy, I expect users of a system based on location crossing to simply turn them off due to the large number of false positives.

These location traces, even though they are crude, are also highly identifying. When going about your normal pre-pandemic life, you move from location X to Y to Z. Typically no one else goes from X to Y to Z in the same timeframe (clocks are typically very accurate). If you test positive and make your trace available to help suppress the virus, a store owner with a video camera and a credit card record might de-anonymize you and accuse you of killing someone they care about. Given the stakes here, preserving as much anonymity as possible is critical for convincing people to release the information which is needed to control the virus.

Given this, approaches which upload the location data of users seem likely to have reduced adoption and many false positives. While some governments are choosing to use all location data on an involuntary basis like Israel, the lack of effectiveness compared to proximity based approaches and the draconian compromise of civil liberties are worrisome.

Location traces can be useful in a privacy-preserving way
Understanding the above, people often conclude that location traces are subsumed by alternatives. That’s not true. Location approaches can be made very private by simply never allowing a location trace leave the personal device. While this might feel contradictory to epidemiological success, it’s actually extremely helpful in at least two ways.

  1. People have a pretty poor memory, so when they test positive and someone calls them up to do a contact tracing interview, having a location trace on their phone can be incredibly useful in jogging their memory. Using the location trace this way allows the manual contact tracing process to be much more complete. It can also be made much faster by allowing infected people to prefill much of a contact interview form before they get a call.
  2. The virus is inherently very localized, so public health authorities often want to quickly talk to people at location X or warn people to stay away from location Y until it is cleaned. This can be strongly enabled by on-device location traces. The phone can download all the public health messages in a region and check automatically which are relevant to the phone’s location trace, surfacing those as needed to the user. This provides more power than crossing location traces. A message of “If you were at store X on April 16th, please email w@y.z” allows people to not respond if they went to store V next door.

Both of these capabilities are a part of the UW PACT protocols I worked on for this reason.

Proximity-only approaches have an x2 problem

When people abandon location-based approaches, it’s in favor of proximity-based approaches. For any proximity protocol approach to work, both the infected person and the contact must be running the protocol implying there are two ways for it to fail to be useful.
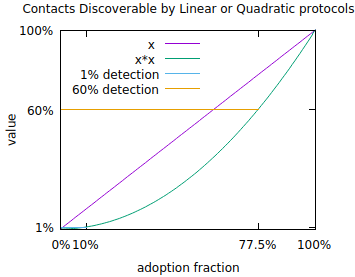
illustration of x*x
To get a sense of what is necessary, consider the reproduction number of the coronavirus. Estimates vary but a reproduction number of 2.5 is reasonable. That is, the virus might infect 2.5 new people per infected person on average in the absence of countermeasures. To keep an infection with a base reproduction number of 2.5 from exponentiating, it is necessary to reduce the reproduction number to 1 which can be done when 60% of contacts are discovered, assuming (optimistically) no testing error and perfect isolation of discovered contacts before they infect anyone else.

To reach 60% you need 77.5% of people to download and run proximity protocols. This is impossible in many places where smartphones are owned by fewer than 77.5% of the population. Even in places where it’s possible it’s difficult to imagine reaching that level of usage without it being a mandatory part of the operating system that you are forced to use. Even then, subpopulations without smartphones are not covered. The square problem gets worse at lower levels of adoption. At 10% adoption (which corresponds to a hugely popular app), only 1% of contacts can be discovered via this mechanism. Despite the smallness, informing 1% of contacts does have real value in about the same sense that if someone loaned you money with a 1%/week interest rate you would call them a loan shark. At the same time, this is only 1/60th of a solution to getting the reproduction number below 1.

Hence, people advocating for proximity approaches must either hope for pervasive mandatory use (which will still miss subcommunities without smartphones) or accept that proximity approaches are only a part of the picture.

This quadratic structure also implies that the number of successful proximity tracing protocols will be either 0 or 1 in any geographic region. Given that Apple/Google are building a protocol into their OSes, that’s the candidate for the possible 1 in most of the world once it becomes available(**).

This quadratic structure is difficult to avoid. For example, if location traces are crossed with location traces, the same issue comes up. Similarly for proximity tracing, you could imagine recording “wild” bluetooth beacons and then reporting them to avoid the quadratic structure. This however unavoidably reveals contacts publicly which can then cause the positive person to be revealed publicly.

Interestingly, traditional manual contact tracing does not suffer from the quadratic problem. Hence approaches (discussed above) which augment and benefit from manual contact tracing have a linear value structure, which matters enormously with lower levels of adoption.

What works?
The primary thrust of contract tracing needs to be manual, as that is what has worked in countries (like South Korea) which suppressed large outbreaks. Purely digital approaches don’t seem like a credible solution due to issues discussed above. Hybrid approaches with smartphone-based apps can help by complementing manual contact tracing and perhaps via proximity approaches. Getting there requires high levels of adoption, which implies trust is a critical commodity. In addition to navigating the issues above, projects need to be open source, voluntary, useful, and strongly respect privacy (the ACLU recommendations are good here). This is what the CovidSafe project is aimed at in implementing the UW PACT protocols. Projects not navigating the above issues as well are less credible in my understanding.

An acknowledgement: many people have affected my thinking through this process, particularly those on the UW PACT paper and CovidSafe projects.

(*) I have no idea how the name collision occurred. We started using PACT here, 3 weeks ago, and circulated drafts to many people including a subset of the MIT PACT group before putting it on arxiv.

(**) The Apple protocol is a bit worrisome as development there is not particularly open and I have a concern about the crypto protocol. The Tracing Key on page 5, if acquired via hack or subpeona, allows you to prove the location of a device years after the fact. This is not epidemiologically required and there are other protocols without this weakness. Edit: The new version of their protocol addresses this issue.

What is the most effective policy response to the new coronavirus pandemic?

Disclaimer: I am not an epidemiologist, but there is an interesting potentially important pattern in the data that seems worth understanding.

World healthcare authorities appear to be primarily shifting towards Social Distancing. However, there is potential to pursue a different strategy in the medium term that exploits a vulnerability of this disease: the 5 day incubation time is much longer than a 4 hour detection time. This vulnerability is real—it has proved exploitable at scale in South Korea and in China outside of Hubei.

Exploiting this vulnerability requires:

  1. A sufficient capacity of rapid tests be available. Sufficient here is perhaps 30 times the number of true new cases per day based on South Korea’s testing rate.
  2. The capacity to rapidly trace the contacts of confirmed positive cases. This is both highly labor intensive and absurdly cheap compared to shutting down the economy.
  3. Effective quarantining of positive and suspect cases. This could be in home, with the quarantine extended to the entire family. It could also be done in a hotel (… which are pretty empty these days), or in a hospital.

Where Test/Trace/Quarantine are working, the number of cases/day have declined empirically. Furthermore, this appears to be a radically superior strategy where it can be deployed. I’ll review the evidence, discuss the other strategies and their consequences, and then discuss what can be done.

Evidence for Test/Trace/Quarantine
The TTQ strategy works when it effectively catches a 1 – 1 / reproduction number fraction of cases. The reproduction number is not precisely known although discovering 90% of cases seems likely effective and 50% of cases seems likely ineffective based on public data.

How do you know what fraction of cases are detected? A crude measure can be formed by comparing detected cases / mortality across different countries. Anyone who dies from pneumonia these days should be tested for COVID-19 so the number of deaths is a relatively trustworthy statistic. If we suppose the ratio of true cases to mortality is fixed, then the ratio of observed cases to mortality allows us to estimate the fraction of detected cases. For example, if the true ratio between infections and fatalities is 100 while we observe 30, then the detection rate is 30%.

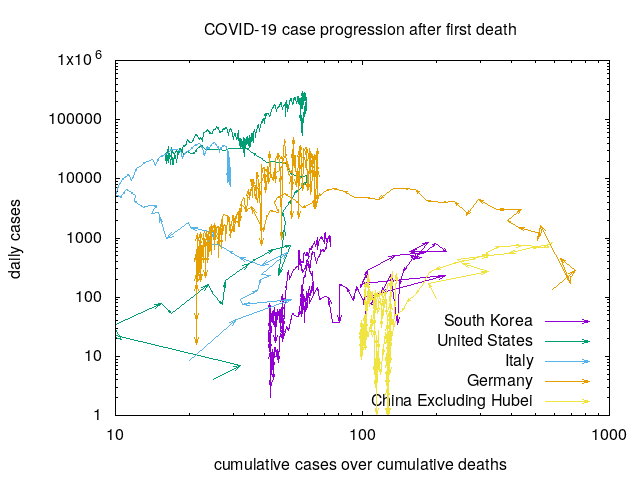
There are many caveats to this analysis (see below). Nevertheless, this ratio seems to provide real information which is useful in thinking about the future. Drawing data from the Johns Hopkins COVID-19 time series, and plotting we see:

The arrows here represent the progression of time by days with time starting at the first recorded death. The X axis here is the ratio between cumulative observed cases and cumulative observed deaths. Countries that are able and willing to test widely have progressions on the right while those that are unable or unwilling to test widely are on the left. Note here that the X axis is on a log scale allowing us to see small variations in the ratio when the ratio is small and large variations in the ratio when the ratio is large.

The Y axis here is the number of cases/day. For a country to engage in effective Test/Trace/Quarantine, it must effectively test, which the X axis is measuring. Intuitively, we expect countries that test effectively to follow up with Trace and Quarantine, and we expect this to result in a reduced number of cases per day. This is exactly what is observed. Note that we again use a log scale for the Y axis due to the enormous differences in numbers.

There are several things you can read from this graph that make sense when you consider the dynamics.

  1. China excluding Hubei and South Korea had outbreaks which did not exceed the hospital capacity since the arrows start moving up and then loop back down around a 1% fatality rate.
  2. The United States has a growing outbreak and a growing testing capacity. Comparing with China-excluding-Hubei and South Korea’s outbreak, only a 1/4-1/10th fraction of the cases are likely detected. Can the United States expand capacity fast enough to keep up with the growth of the epidemic?
  3. Looking at Italy, you can see evidence of an overwhelmed healthcare system as the fatality rate escalates. There is also some hope here, since the effects of the Italian lockdown are possibly starting to show in the new daily cases.
  4. Germany is a strange case with an extremely large ratio. It looks like there is evidence that Germany is starting to control their outbreak, which is hopeful and aligned with our expectations.

The creation of this graph is fully automated and it’s easy to graph things for any country in the Johns Hopkins dataset. I created a github repository with the code. Feel free to make fun of me for using C++ as a scripting language 🙂

You can also understand some of the limitations of this graph by thinking through the statistics and generation process.

  1. Mortality is a delayed statistic. Apparently, it’s about a week delayed in the case of COVID-19. Given this, you expect to see the ratio generate loops when an outbreak occurs and then is controlled. South Korea and China-excluding-Hubei show this looping structure, returning to a ratio of near 100.
  2. Mortality is a small statistic, and a small statistic in the denominator can make the ratio unstable. When mortality is relatively low, we expect to see quite a variation. Checking each progression, you see wide ratio variations initially, particularly in the case of the United States.
  3. Mortality may vary from population to population. It’s almost surely dependent on the age distribution and health characteristics of the population and possibly other factors as well. Germany’s ratio is notably large here.
  4. Mortality is not a fixed variable, but rather dependent on the quality of care. A reasonable approximation of this is that every “critical” case dies without intensive care support. Hence, we definitely do not expect this statistic to hold up when/where the healthcare system is overwhelmed, as it is in Italy. This is also the reason why I excluded Hubei from the China data.

Lockdown
The only other strategy known to work is a “lockdown” where nearly everyone stays home nearly all the time, as first used in Hubei. This characterization is simplistic—in practice such a quarantine comes with many other measures as well. This can work very effectively—today the number of new case in Hubei is in the 10s.

The lockdown approach shuts down the economy fast and hard. Most people can’t work, so they can’t make money, so they can’t buy things, so the people who make things can’t make money, so they go broke, etc… This is strongly reflected in the stock market’s reaction to the escalating pandemic. If the lockdown approach is used for long most people and companies are destined for bankruptcy. If a lockdown approach costs 50% of GDP then a Test/Trace/Quarantine approach costing only a few% of GDP seems incredibly cheap in comparison.

The lockdown approach is also extremely intrusive. It’s akin to collective punishment in that it harms the welfare of everyone, regardless of their disease status. Many peoples daily lives fundamentally depend on moving around—for example people using dialysis.

Despite this, the lockdown approach is being taken up everywhere that cases are overwhelming or threaten to overwhelm hospitals because the alternative (next) is even worse. One advantage that a lockdown approach has is that it can be used now while the Test/Trace/Quarantine approach requires more organizing. It’s the best bad option when the Test/Trace/Quarantine capacity is exceeded or to bridge the time until it becomes available.

If/when/where Test/Trace/Quarantine becomes available, I expect it to be rapidly adopted. This new study (page 11) points out that repeated lockdowns are close to permanent lockdowns in effect.

Herd Immunity
Some countries have considered skipping measures to control the virus on the theory that the population eventually acquires enough people with individual immunity after recovery so the disease dies out. This approach invites severe consequences.

A key issue here is: How bad is the virus? The mortality rate in China excluding Hubei and South Korea is only about 1%. From this, some people appear to erroneously reason that the impact of the virus is “only” having 1% of 50% of the population die, heavily weighted towards older people. This reasoning is fundamentally flawed.

The mortality rate is not a fixed number, but rather dependent on the quality of care. In particular, because most countries have very few intensive care units, an uncontrolled epidemic effectively implies all but a vanishing fraction of sick people only benefit from home stay quality of care. How many people could die with home stay quality of care? Essentially everyone who would otherwise require intensive care at a hospital. In China, that meant 6.1% (see page 12). Given this, the sound understanding is that COVID-19 generates a factor 2-3 worse mortality than the 1918 influenza pandemic where modern healthcare might make this instead be half as bad when not overwhelmed. Note here that the fatality rate in Hubei (4.6% of known cases, which might be 3% of total cases) does not fully express how bad this would be due to the fraction of infected people remaining low and a surge of healthcare support from the rest of China.

The herd immunity approach also does not cause the disease to die out—instead it continues to linger in the population for a long time. This means that people traveling from such a country will be effectively ostracized by every country (like China or South Korea) which has effectively implemented a Test/Trace/Quarantine approach.

I’ve avoided discussing the ethics here since people making this kind of argument may not care about ethics. For everyone else it’s fair to say that letting part of the population die to keep the economy going is anathema. My overall expectation is that governments pursuing this approach are at serious risk of revolt.

Vaccine

Vaccines are extremely attractive because they are a very low cost way to end the pandemic. They are however uncertain and take time to develop and test, so they are not a viable strategy for the next few months.

What can be done?

Public health authorities are generally talking about Social Distancing. This is plausibly the best general-public message because everyone can do something to help here.

It’s also clear that healthcare workers, vaccines makers, and everyone supporting them have a critical role to play.

But, perhaps there’s a third group that can really help? Perhaps there are people who can help scale up the Test/Trace/Quarantine approach so it can be rapidly adopted? Natural questions here are:

  1. How can testing be scaled up rapidly—more rapidly than the disease? This question is already getting quite a bit of attention, and deservedly so.
  2. How can tracing be scaled up rapidly and efficiently? Hiring many people who are freshly out of work is the most obvious solution. That could make good sense given the situation. However, automated or partially automated approaches have the potential to greatly assist as well. I hesitate to mention cell phone tracking because of the potential for abuse, but can that be avoided while still gaining the potential public health benefits?
  3. How can quarantining be made highly precise and effective? Can you estimate the risk of infection with high precision? What support can safely be put in place to help those who are quarantined? Can we avoid the situation where the government says “you should quarantine” and “people in quarantine can’t vote”?

Some countries started this pandemic setup for relatively quick scaleup of the Test/Trace/Quarantine. Others, including the United States, seem to have been unprepared. Nevertheless, I am still holding out hope that the worst case scenarios (high mortality or months-long lockdowns) can be largely avoided as the available evidence suggests that this is certainly possible. Can we manage to get the number of true cases down (via a short lockdown if necessary) to the point where an escalating Test/Trace/Quarantine approach can take over?

Edit: I found myself remaking the graph for myself personally so I made it update hourly and added New York (where I live).

Coronavirus and Machine Learning Conferences

I’ve been following the renamed COVID-19 epidemic closely since potential exponentials deserve that kind of attention.

The last few days have convinced me it’s a good idea to start making contingency plans for machine learning conferences like ICML. The plausible options happen to be structurally aligned with calls to enable reduced travel to machine learning conferences, but of course the need is much more immediate.

I’ll discuss relevant observations about COVID-19 and then the impact on machine learning conferences.

COVID-19 observations

  1. COVID-19 is capable of exponentiating with a base estimated at 2.13-3.11 and a doubling time around a week when unchecked.
  2. COVID-19 is far more deadly than the seasonal flu with estimates of a 2-3% fatality rate but also much milder than SARS or MERS. Indeed, part of what makes COVID-19 so significant is the fact that it is mild for many people leading to a lack of diagnosis, more spread, and ultimately more illness and death.
  3. COVID-19 can be controlled at a large scale via draconian travel restrictions. The number of new observed cases per day peaked about 2 weeks after China’s lockdown and has been declining for the last week.
  4. COVID-19 can be controlled at a small scale by careful contact tracing and isolation. There have been hundreds of cases spread across the world over the last month which have not created new uncontrolled outbreaks.
  5. New significant uncontrolled outbreaks in Italy, Iran, and South Korea have been revealed over the last few days. Some details:
    1. The 8 COVID-19 deaths in Iran suggests that the few reported cases (as of 2/23) are only the tip of the iceberg.
    2. The fact that South Korea and Italy can suddenly discover a large outbreak despite heavy news coverage suggests that it can really happen anywhere.
    3. These new outbreaks suggest that in a few days COVID-19 is likely to become a world-problem with a declining China aspect rather than a China-problem with ramifications for the rest of the world.

There remains quite a bit of uncertainty about COVID-19, of course. The plausible bet is that the known control measures remain effective when and where they can be exercised with new ones (like a vaccine) eventually reducing it to a non-problem.

Conferences
The plausible scenario leaves conferences still in a delicate position because they require many things go right to function. We can easily envision 3 quite different futures here consistent with the plausible case.

  1. Good case New COVID-19 outbreaks are systematically controlled via proven measures with the overall number of daily cases declining steadily as they are right now. The impact on conferences is marginal with lingering travel restrictions affecting some (<10%) potential attendees.
  2. Poor case Multiple COVID-19 outbreaks turn into a pandemic (=multi-continent epidemic) in regions unable to effectively exercise either control measure. Outbreaks in other regions occur, but they are effectively controlled. The impact on conferences is significant with many (50%?) avoiding travel due to either restrictions or uncertainty about restrictions.
  3. Bad case The same as (2), except that an outbreak occurs in the area of the conference. This makes the conference nonviable due to travel restrictions alone. It’s notable here that Italy’s new outbreak involves travel lockdowns a few hundred miles/kilometers from Vienna where ICML 2020 is planned.

Even the first outcome could benefit from some planning while gracefully handling the last outcome requires it.

The obvious response to these plausible scenarios is to reduce the dependence of a successful conference on travel. To do this we need to think about what a conference is in terms of the roles that it fulfills. The quick breakdown I see is:

  1. Distilling knowledge. Luckily, our review process is already distributed.
  2. Passing on knowledge.
  3. Meeting people, both old friends and discovering new ones.
  4. Finding a job / employee.

How (and which) of these can be effectively supported remotely?

I’m planning to have discussions over the next few weeks about this to distill out some plans. If you have good ideas, let’s discuss. Unlike most contingency planning, it seems likely that efforts are not wasted no matter what the outcome 🙂

Updates for the new decade

This blog has been quiet for the last year. I have quite a bit to write about but found myself often out of time between work at Microsoft, ICML duties, and family life. Nevertheless, I expect to get back to more substantive discussions as I adjust to the new load.

In the meantime, I’ve updated the site in various ways: SSL now works, and mail for people registering new accounts should work again.

I also setup a twitter account as I’ve often had things left unsaid. I’m not a fan of blog-by-twitter (which seems artificially disjointed), so I expect to use twitter for shorter things and hunch.net for longer things.